Eliminar xticks en un gráfico matplotlib?
Tengo una parcela semilogx y me gustaría eliminar los xticks. Lo intenté:
plt.gca().set_xticks([])
plt.xticks([])
ax.set_xticks([])
La cuadrícula desaparece (ok), pero quedan pequeñas marcas (en el lugar de las marcas principales). Cómo eliminarlos?
7 answers
El tick_params el método es muy útil para cosas como esta. Este código desactiva las marcas mayores y menores y elimina las etiquetas del eje x.
from matplotlib import pyplot as plt
plt.plot(range(10))
plt.tick_params(
    axis='x',          # changes apply to the x-axis
    which='both',      # both major and minor ticks are affected
    bottom=False,      # ticks along the bottom edge are off
    top=False,         # ticks along the top edge are off
    labelbottom=False) # labels along the bottom edge are off
plt.show()
plt.savefig('plot')
plt.clf()
Warning: date(): Invalid date.timezone value 'Europe/Kyiv', we selected the timezone 'UTC' for now. in /var/www/agent_stack/data/www/ajaxhispano.com/template/agent.layouts/content.php on line 61
2018-05-02 15:10:49
No es exactamente lo que el OP estaba pidiendo, pero una forma sencilla de desactivar todas las líneas de los ejes, garrapatas y etiquetas es simplemente llamar:
plt.axis('off')
Warning: date(): Invalid date.timezone value 'Europe/Kyiv', we selected the timezone 'UTC' for now. in /var/www/agent_stack/data/www/ajaxhispano.com/template/agent.layouts/content.php on line 61
2014-01-24 00:38:53
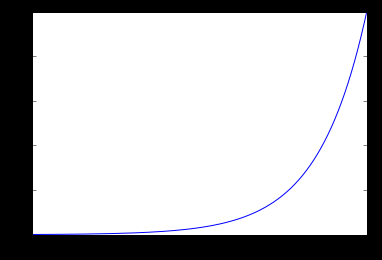
Aquí hay una solución alternativa que encontré en la lista de correo de matplotlib :
import matplotlib.pylab as plt

x = range(1000)
ax = plt.axes()
ax.semilogx(x, x)
ax.xaxis.set_ticks_position('none')
Warning: date(): Invalid date.timezone value 'Europe/Kyiv', we selected the timezone 'UTC' for now. in /var/www/agent_stack/data/www/ajaxhispano.com/template/agent.layouts/content.php on line 61
2015-11-14 10:56:26
Alternativamente, puede pasar una posición de marca vacía y etiquetar como
plt.xticks([], [])
Warning: date(): Invalid date.timezone value 'Europe/Kyiv', we selected the timezone 'UTC' for now. in /var/www/agent_stack/data/www/ajaxhispano.com/template/agent.layouts/content.php on line 61
2016-09-20 15:39:22
Hay una solución mejor y más simple que la dada por John Vinyard. Use NullLocator:
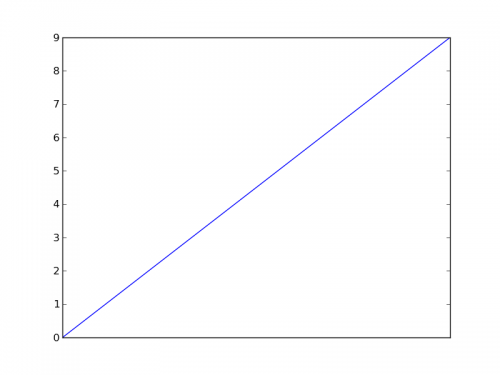
import matplotlib.pyplot as plt

plt.plot(range(10))
plt.gca().xaxis.set_major_locator(plt.NullLocator())
plt.show()
plt.savefig('plot')
Espero que eso ayude.
Warning: date(): Invalid date.timezone value 'Europe/Kyiv', we selected the timezone 'UTC' for now. in /var/www/agent_stack/data/www/ajaxhispano.com/template/agent.layouts/content.php on line 61
2012-10-21 16:37:39
Intente esto para eliminar las etiquetas (pero no las marcas):
import matplotlib.pyplot as plt

plt.setp( ax.get_xticklabels(), visible=False)
Warning: date(): Invalid date.timezone value 'Europe/Kyiv', we selected the timezone 'UTC' for now. in /var/www/agent_stack/data/www/ajaxhispano.com/template/agent.layouts/content.php on line 61
2014-03-20 15:16:41
Este fragmento podría ayudar a eliminar los xticks solamente.
from matplotlib import pyplot as plt
plt.xticks([])
Este fragmento podría ayudar a eliminar los xticks y los yticks.
from matplotlib import pyplot as plt
plt.xticks([]),plt.yticks([])
Warning: date(): Invalid date.timezone value 'Europe/Kyiv', we selected the timezone 'UTC' for now. in /var/www/agent_stack/data/www/ajaxhispano.com/template/agent.layouts/content.php on line 61
2018-06-12 16:35:29